
By Lech Biegalski
(Originally published on September 14, 2020)
September is the month in which annual mortality statistics were usually published by our governments. This year, however, the story is different. Governments are not publishing mortality data. They are blaming it on Covid-19, even though the overall number of deaths was always published without quoting causes of death and such basic data is surely available today.
I have decided to follow the trial abandoned by the governments. The task wasn’t easy, as we are still waiting for the “official” numbers, but I was able to research and collect data that allowed me to draw alarming conclusions and ask some interesting questions.
Here is my table. It is based on two strings of numbers:
- Canadian population growth for years 2000 to 2020 – (Source);
- Canadian Deaths for the same period of time – (Source)
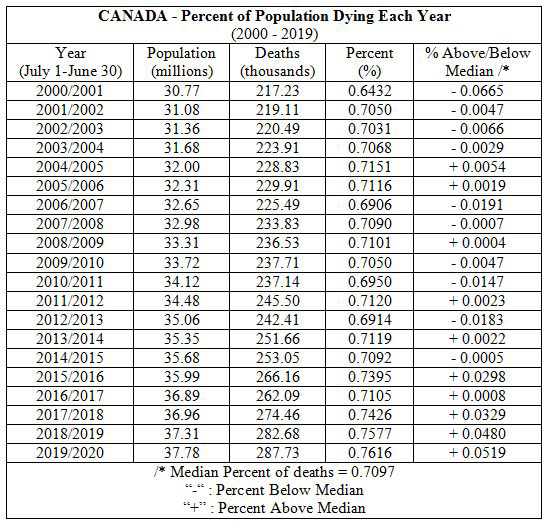
Instead of operating on numbers, I used percents to illustrate what part of Canadian population died every year between 2000 and 2020. This allowed me to eliminate the impact of the population growth on the annual number of deaths.
Then, I calculated the median. It turned out that the median percent of Canadian population deaths each year between 2000 and 2020 was 0.7097%. These are all deaths in total, regardless of causes. During some years, the number of deaths was lower than the median. During other years is was higher.
Based on this data, I used a spreadsheet and created the following graph:

Each bar in this graph represents a year from July 1 to June 30. Therefore, the graph includes six first months of the year 2020 – the year of the pandemic.
The middle horizontal axis, marked as “0” is the median percent of deaths for data presented in this graph. It equals 0.7097%. It means that a median of about 0.7% of Canadian population died each year during this period of time.
As you can see in the graph, above, the lowest percent of deaths occurred in 2000/2001. Then, from 2001 to 2015, the annual percents of deaths stayed close to the median and did not change much. Lower mortality occurred in 2006/2007, 2010/2011, and 2012/2013. For example, in 2006/2007, there was 11,940 fewer deaths than the median for the period of time between 2000 and 2020 (this median being 237,430).
The graph shows that something has changed in and after 2015. The percent of deaths in Canadian population has visibly increased:
- in 2015/2016, the actual number of deaths exceeded the median number of deaths by 28,730
- in 2017/2018, by 37,030
- in 2018/2019, by 45,250, and
- in 2019/2020, by 50,300 deaths.
This recent spike in annual deaths among Canadian population is also clearly visible in the above graph.
Considering that, according to official estimates. the total number of fatalities due to the Covid-19 pandemic in Canada, as of today (September 14, 2020), is 9,172, an alarming question surfaces, “What is causing the spike in Canadian death statistics in recent years? It is worth noting that this spike began in 2015/2016 (four years before the “pandemic” began). It is also very curious that, in 2019/2020, (the year of the pandemic in Canada), the increase in the number of deaths in relation to the 20-year median is more than 4 times higher than all the “official” Canadian Covid-19 fatalities added together.
It is possible that the governments and the media use the above trend to “smuggle in” the Covid-19 into future statistics that we are waiting for. The real question is: What is killing us and why is it being used to justify and inflate the pandemic scare and fear mongering that serve other agendas? For what reason and for what end?
There is a different possible explanation of this phenomenon. Demographics. Maybe the spike in number of deaths tells us that the baby-boomers have entered a dying age. Possible, but if this is the case, we want the government to present this fact openly and honestly. We don’t want it to masquerade as Covid-19. We are not that stupid.
=================================
Here is the data I have used for this article:
https://mydundasvalley.com/wp-content/uploads/2020/09/canada-deaths-2000-2020-data-1.pdf
Related article:
Related information:
I have also conducted similar statistical analysis for Poland, where the overall number of deaths between January 1 and July 31 of 2020 was actually lower than during the same period of time in 2018 and 2019 – in spite of vicious fear campaign by politicians and mainstream media.